Key Points
Every year, thousands of cryptocurrencies come into the market, aiming to secure a seat in the top 100 by market capitalization.
Market cap has become a token of credibility, as it indicates strong demand, solid tokenomics, and a steadily rising price.
In 2026, market cap continues to be the primary filter through which investors analyze liquidity, growth, and “The Lindy Effect” – the idea that the longer a network survives and manages to push the price of its native asset higher, the more likely it is to survive.
Cryptocurrency Market Cap Decoded: Why Price is Not the Most Relevant Factor
If you are relatively new to the crypto market, the most common pitfall is looking at the price of a coin as a reflection of its value. You might see a token priced at $0.0005 and think, “If this goes to $1, I’ll be a millionaire.” This is a misunderstanding of how market structure works.
Market capitalization is the true measure of a project’s “size” in the global crypto economy. It is calculated by taking the current market price of an asset and multiplying it by the total number of coins that are currently in circulation.
Market Cap = Price x Circulating Supply
There are a handful of other metrics used to calculate similar magnitudes, like the Fully Diluted Valuation (FDV), which takes into consideration the total supply set by the project instead of the circulating supply.
The Three Tiers of the 2026 Crypto Market
We categorized the 10,000+ existing crypto assets into three different tiers based on their weight relative to the entire market’s combined market cap.
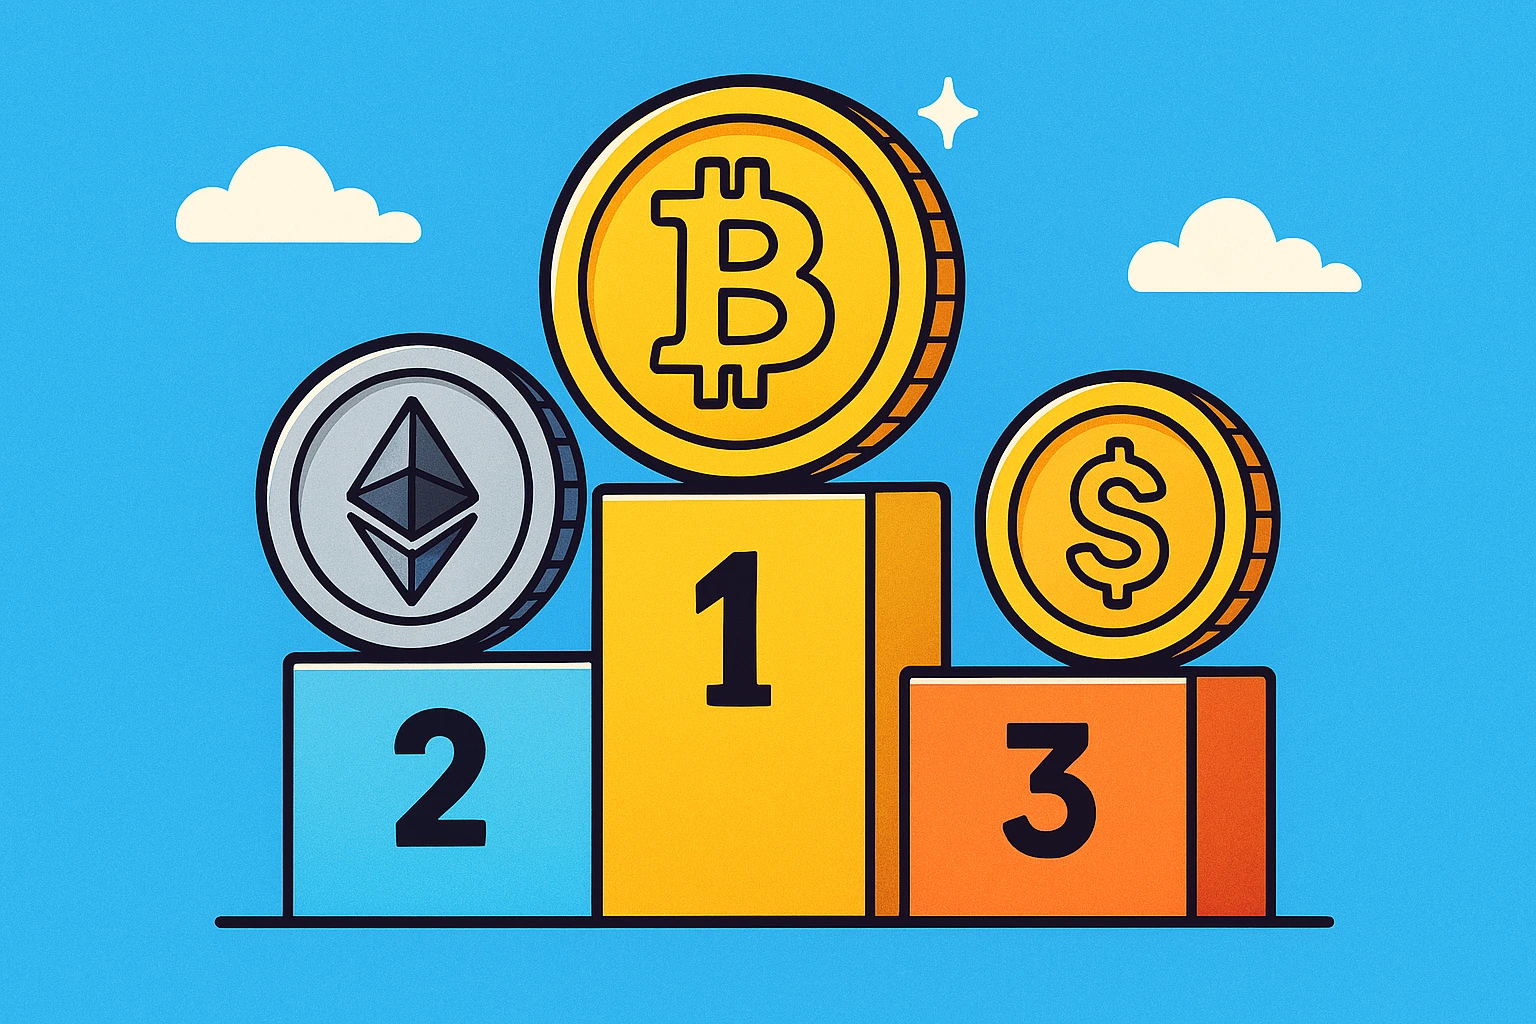
Large-Cap Tokens ($100 Billion+)
These are the “Blue Chips” of the crypto world. In 2026, this category is dominated by Bitcoin (BTC) and Ethereum (ETH), but also includes the world’s most popular and used stablecoin, Tether’s USDT (USDT)
- Characteristics: High liquidity (easy to buy/sell without moving the price), lower volatility compared to the rest of the market, and heavy institutional ownership via ETFs.
- Role in Portfolio: These act as your “anchor.” They typically make up for 60% of most crypto-focused portfolios.
Mid-Cap Tokens ($10 Billion to $99 Billion)
This is where the most interesting technical innovations happen. These projects have demonstrated their “product-market fit” but still have significant room for exponential growth in the future.
Notable players in this segment include BNB (BNB), Solana (SOL), XRP (XRP), and a promising newcomer – Hyperliquid (HYPE).
- Characteristics: Moderate volatility. These assets often outperform Bitcoin during “Altcoin Season” but can drop by 50% quickly during a market correction.
- Role in Portfolio: Growth engines. These are your “future bets” in the decentralized finance (DeFi) space or among purpose-built blockchains.
Small-Cap Tokens ($1 Billion to $10 Billion)
A large number of tokens, many of which boast strong communities, brands, and robust technical performance, fall into this category.
It includes projects like Chainlink (LINK), Uniswap (UNI), and Aave (AAVE), all of which have sound value propositions and offer the most attractive upside potential as blockchain technology becomes more widely adopted.
- Characteristics: Highly volatile. They offer the potential for 10x returns in the long run, but can also drag down a portfolio if they are bought at the wrong stage of the cycle.
- Role in Portfolio: High-risk, high-reward plays. Only a small percentage of a portfolio should live here if you are a risk-averse investor.
The Bitcoin Dominance Index: A Key Indicator for Market Cycles
Bitcoin’s dominance in the crypto market is a key metric to understand market cycles. This percentage represents how much of the total market cap of cryptos comes from BTC alone.
In March 2026, BTC’s dominance sits near 58%. When this number rises, it usually means that investors are “fleeing to safety.” When it falls, capital is rotating into riskier altcoins.
Understanding this tactical allocation can make a huge difference in better timing your purchases and sales.
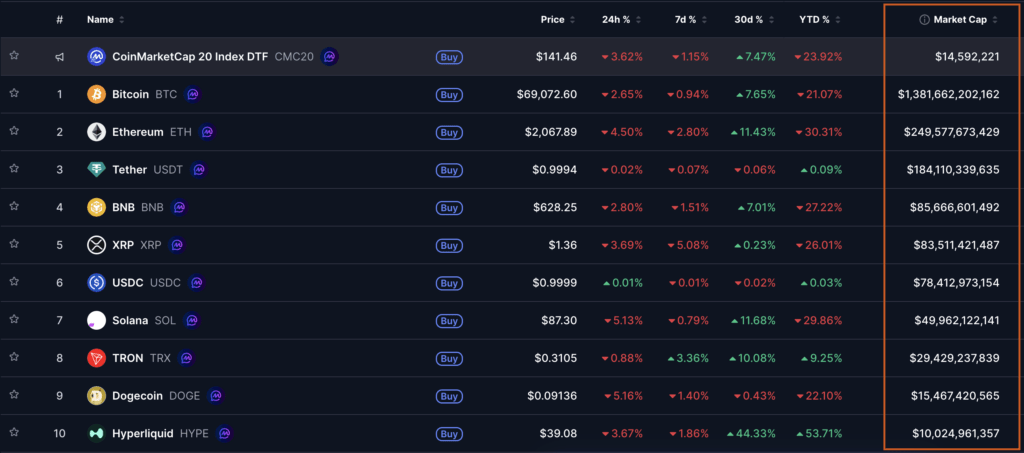
Summary Table: The Top 5 Cryptocurrencies by Market Cap (March 2026)
| Asset | Market Cap (Est) | Primary Driver | Value Proposition |
| Bitcoin (BTC) | $1.4 Trillion | Digital Gold Narrative ETF Demand | Macro Hedge |
| Ethereum (ETH) | $250 Billion | Smart Contracts Decentralized Finance (DeFi) | Utility |
| Tether (USDT) | $185 Billion | Liquidity | Stability |
| BNB (BNB) | $85 Billion | Low-cost transactions Binance ecosystem rewards | Growth |
| XRP (XRP) | $83 Billion | Cross-Border Payments | Enterprise-Grade Payments Network |
