Key Points
Cryptocurrencies often move faster and more violently than traditional assets. While headlines and sentiment play a role in shaping digital assets’ valuations, many of these moves are better explained by derivatives positioning and reflected by a change in open interest.
Open interest (OI) is a metric that illustrates how much leverage the system is taking in and whether price action is being driven by fresh participation or forced unwinding. Understanding this metric could help traders identify true breakouts and trend reversals.
What Open Interest Really Tells You
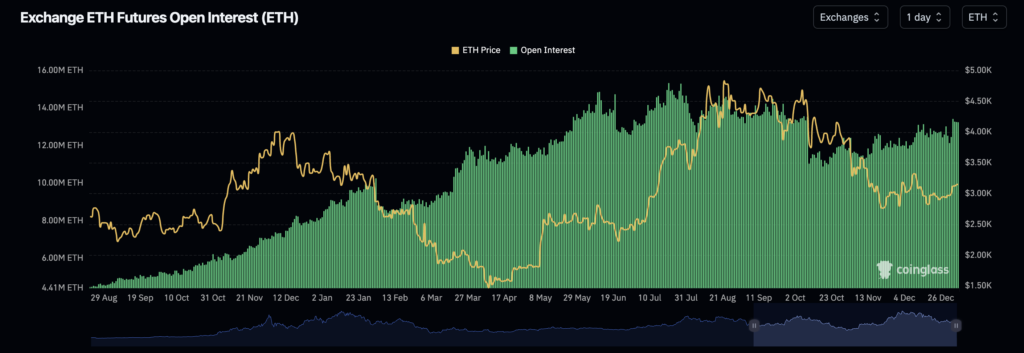
Open interest measures the total amount of outstanding futures contracts that have not yet been settled. Unlike volume, which tracks the amount of assets that are exchanging hands in real time, OI shows how much exposure remains open in the market.
When OI rises alongside price, it typically indicates that new positions are being added, often reinforcing the prevailing trend. This suggests conviction, but it also increases systemic risk as leverage starts to build up.
| Open Interest (OI) | Price | Interpretation |
|---|---|---|
| Rises | Rises | Confirms the strength of the current trend. Increased risk of pullback as leveraged positions are starting to build up. |
| Falls | Rises | Short-covering. It signals weak conviction and typically indicates a bear-market rally. |
| Falls | Falls | Broad risk-off move. A correction has started and a bear market may have begun. |
| Rises | Falls | Extreme short-positioning. It could lead to short-squeezes unless justified by dramatic changes in economic or market conditions. |
In contrast, when OI falls while prices rise, the move is more likely driven by short covering rather than fresh demand. These rallies can be quite explosive, but could rapidly unwind as forced short-covering is rapidly exhausted.
Conversely, falling prices with declining OI usually signal long liquidations and a broad risk-off move, while falling prices with rising OI point to aggressive short positioning — a setup that can lead to sudden squeezes.
Leverage, Liquidations, and Chain Reactions
Leverage is a critical price driver in the crypto market, and open interest helps quantify how much of it is in play. High OI levels relative to market capitalization or spot volume suggest that the price action is being supported by an increase leveraged positions rather than organic demand.
When prices move against heavily leveraged positions, cascade liquidations tend to occur. These forced closures add market orders in the same direction, accelerating the move and creating the cascading price action often seen during volatile sessions.
This is why sudden drops or spikes frequently coincide with sharp declines in open interest. As positions are liquidated, the system flushes out excess leverage to create room for further upward or downward moves.
When Open Interest Divergences Matter Most
Open interest divergences are particularly meaningful near key technical levels. For example, if prices are approaching a key resistance while OI continues to climb, it may indicate overcrowded positioning and increased downside risk if a failed breakout takes place.
Similarly, a breakdown accompanied by flat or declining OI suggests limited conviction among shorts, increasing the odds of a ‘fakeout’.
OI divergences are also useful for distinguishing healthy trends from unsustainable ones. Sustainable trends tend to show measured increases in OI supported by spot market participation. Excessive or parabolic OI growth, on the other hand, often precedes spikes in volatility rather than steady price increases.
Open interest should never be analyzed in isolation. Its real value emerges when combined with funding rates, liquidation data, and spot volume. When these metrics are combined, they reveal whether price moves are driven by genuine demand or leverage-driven imbalances.
